EMA Strategy and Its Parameters
To use EMA filters with formulas for all strategies in the terminal, as well as the EMA strategy for placing Buy orders with a real deposit, you need to activate the paid Auto-Trading Extensions package. If it is not activated, the functions from this package will work only in the general Emulator mode enabled via Menu → Emulation Mode.
EMA FILTER AND EMA STRATEGY
In the strategy settings, the CustomEMA (entry filter condition) and SellByCustomEMA (exit condition) parameters allow you to write formulas that implement custom filter conditions based on comparing prices on coin charts or volumes over different time intervals.
In the CustomEMA or SellByCustomEMA parameter field, a set of comparison functions is written in one line in the following format:
In the CustomEMA or SellByCustomEMA parameter field, a set of comparison functions is written in one line in the following format:
Example: A AND B OR C AND D means either (A AND B) or (C AND D)).
Types of formulas
-
EMA(X,Y) > or < A: comparison of prices for EMA X seconds, minutes, or hours ago and EMA Y seconds, minutes, or hours ago.
Allowed values: X = 1s...300s or 2m...90m or 1h...41h, Y = 1s...300s or 2m...90m or 1h...41h; -
MAX(X,Y) > or < A: comparison of the maximum price over X minutes or hours ago and EMA Y seconds, minutes, or hours ago.
Allowed values: X = 5m...90m or 1h...41h, Y = 1s...300s or 2m...90m or 1h...41h. -
MIN(X,Y) > or < A: comparison of the minimum price over X minutes or hours ago and EMA Y seconds, minutes, or hours ago.
Allowed values: X = 5m...90m or 1h...41h, Y = 1s...300s or 2m...90m or 1h...41h.
See “Calculation methodology” below for details on minimum calculations. -
BTC(X,Y) > or < A: comparison of BTC/USDT prices for EMA X seconds, minutes, or hours ago and EMA Y seconds, minutes, or hours ago.
Allowed values: X = 1s...300s or 2m...90m or 1h...41h, Y = 1s...300s or 2m...90m or 1h...41h. -
MAvg(X,Y) > or < A: comparison of the average market price over EMA X seconds, minutes, or hours ago and EMA Y seconds, minutes, or hours ago.
Allowed values: X = 1s...300s or 2m...90m or 1h...41h, Y = 1s...300s or 2m...90m or 1h...41h.
The calculation of the market average price is affected by two settings:
1. On the Settings → Main tab, Blacklist and Exclude from deltas — if enabled, markets from the Blacklist are excluded from the market average price.
2. On the Settings → Advanced → Engine Settings tab, Weighted mAvg — if enabled, the market price in the average is weighted by its daily volume.
In other words, the smaller the daily volume of a coin, the less it influences the average.
The calculation can be compared to capitalization: it is the sum of (price × volume). -
Avg(X,Y) > or < A: similar to EMA(X,Y). Compares the price X seconds or minutes ago with the price Y seconds or minutes ago.
Allowed values: X = 1s...300s or 2m...90m or 1h...41h, Y = 1s...300s or 2m...90m or 1h...41h.
If Y = 1, the current price is used. The average price line can be seen on the chart by enabling AvgPrice. -
Vol(X,Y) > or < A: volume comparison formula. X and Y can be: 5s, 15s, 30s, 1m, 3m, 5m, 15m, 30m, 1h, 3h, 24h.
The calculation is performed as: (average minute volume over period Y) divided by (average minute volume over period X).
Example: hourly volume = 120,000 USDT (average minute volume over the hour = 2,000 USDT).
Volume over the last minute = 4,000 USDT.
Then Vol(1h,1m) = 4000 / 2000 = 2, meaning the volume in this minute is 2 times higher than the average minute volume over the last hour.
Special case: Vol(0,Y) returns simply the average minute volume over period Y without comparison.
Each formula (X,Y) > or < A means:
1) X,Y — time: a number followed by s, m, or h (seconds, minutes, hours respectively) or without a letter (then the number is treated as seconds); Greater-than or less-than sign;
2) A — the comparison value (in percent).
3) Calculation principle: the average price Y seconds ago is compared with the average price X seconds ago:
Price(Y) / Price(X) > 1 + A / 100
In other words, Price(Y) is greater than Price(X) by A percent (or less, if the formula uses the < sign).
Calculation methodology and limitations
Since it is impossible to store all possible combinations in memory, the MoonBot terminal calculates prices according to the following principle:
-
A set of second-based averages from the current price (1 sec.) up to 300 seconds back. They are calculated as classic EMA values based on the average price for each second:
Pnext[N] = (Pprev[N] * N + Pcurrent) / (N + 1), where N is time in seconds; -
Minute averages from 2 minutes back up to 90 minutes back. They are calculated as the simple average price per minute;
-
Hourly averages from 1 hour back up to approximately 41 hours back (exchange limitation on candles used to calculate hourly averages). They are calculated as the average price per hour based on 5m candles. Accordingly, the X,Y parameters in the EMA formula can be: 1s..300s or 2m..90m or 1h..41h (see the specific ranges for X and Y above next to the relevant MIN, MAX, EMA parameter);
-
If Y is set to 1s, the comparison is made with the current price; when specifying seconds, the letter s may be omitted;
-
Hourly MAX/MIN values are recalculated once every 5 minutes, as a new 5m candle appears. To prevent MAX(1h)/MIN(1h) and MAX(60m)/MIN(60m) from duplicating each other, hourly values start directly from 1 hour back. For example, for MAX(1h,1), the maximum value is taken from 5m candles covering the period from 60 to 120 minutes ago;
-
Minute MAX/MIN values are recalculated on every tick (1 tick = 2 seconds), meaning with a delay of 2 to 4 seconds. The last 60 seconds are not included in the calculation of minute MAX/MIN levels.
Thus, a sharp rise within the last minute (for minute intervals) and within the last 60 minutes (for hourly intervals) is not taken into account when determining MAX/MIN levels. Therefore, at a given moment, the MAX value may be greater than zero and the MIN value may be less than zero. This is designed so that formulas can define a breakout or breakdown condition, meaning a rule where the current price becomes higher than the maximum or lower than the minimum over the last N minutes/hours.
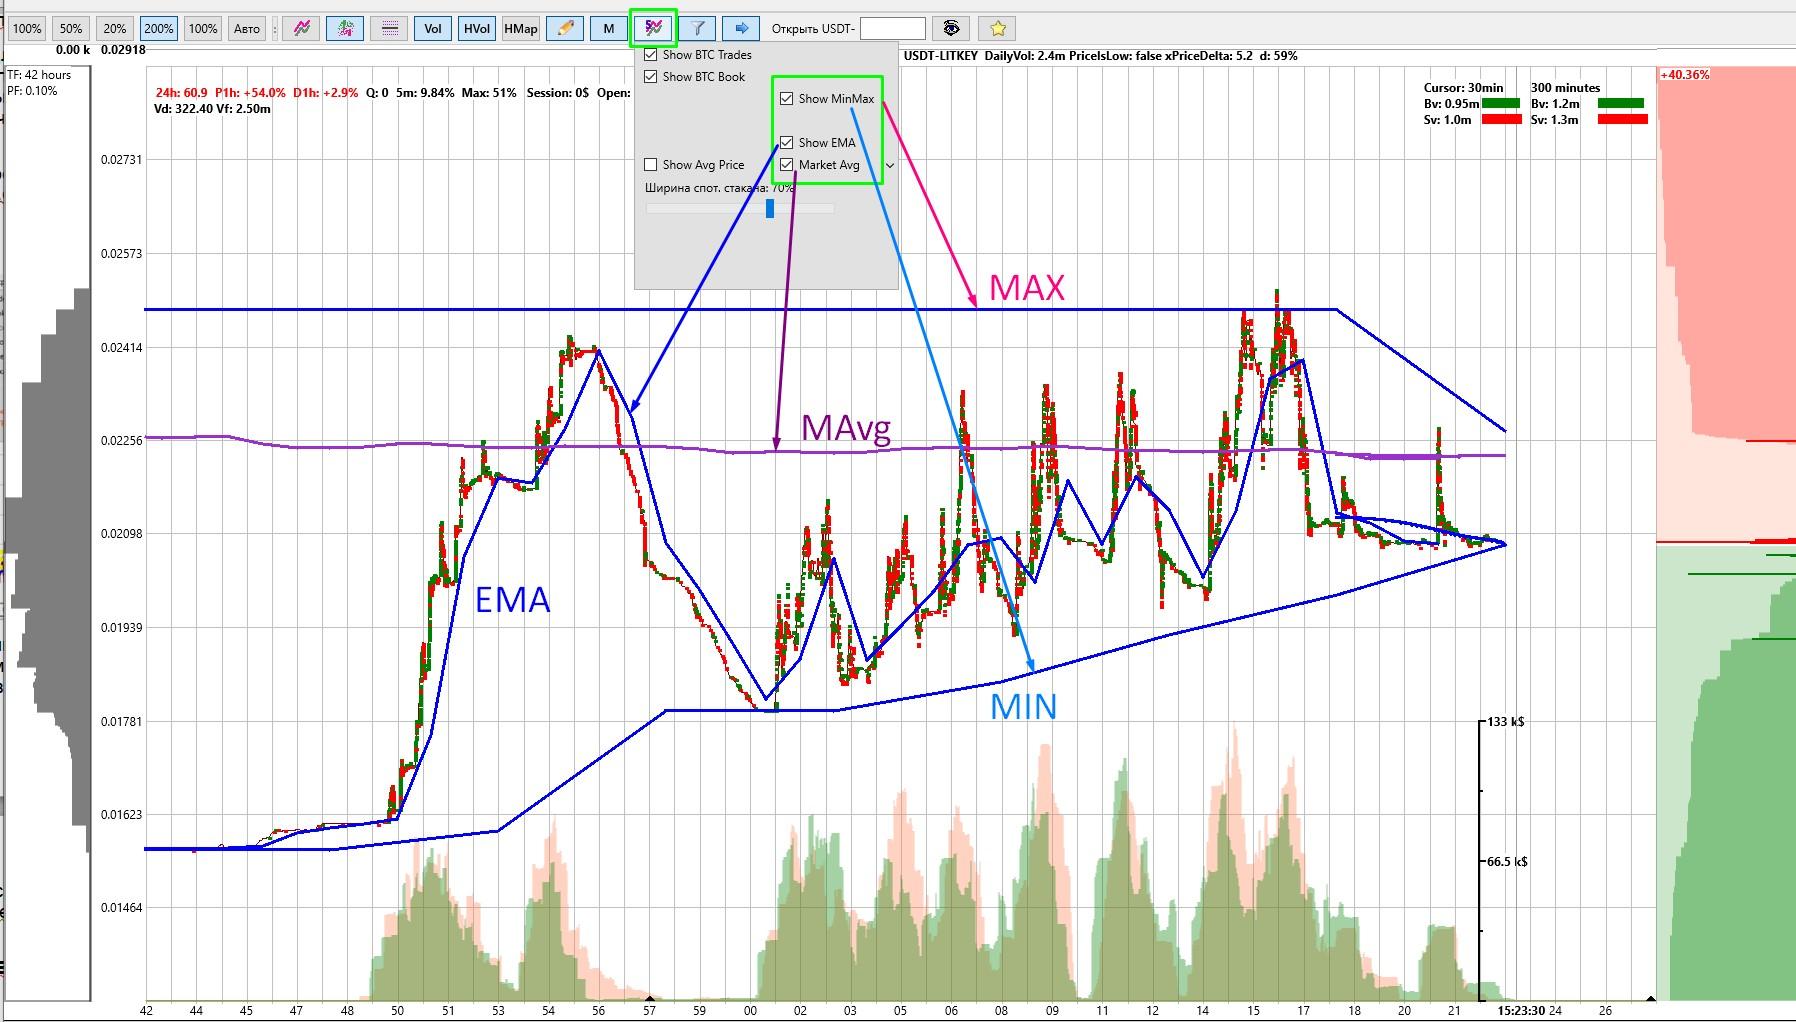
You can display the calculated MAX/MIN, EMA, and MAvg points connected with blue lines on the chart via the menu of the “Show spot trading charts/order books” button (this button is located to the left of the Funnel button), see the figure above.
💡 Please note! This is not an indicator, but only a visual representation of how the EMA filter values are calculated from the points. For the reasons described above, the blue average price line may have gaps — these are the points where 300s ends, where 2m begins, and where 90m ends.
The CustomEMA filter is triggered when all conditions in the formulas are satisfied. Thus, you can define a wide variety of entry conditions, for example, “price decline over a long period followed by growth over a short period,” and so on.
Examples of what can be entered in the CustomEMA field
-
EMA(15m,3s)<-1 AND EMA(5s,1s)>0.1;
EMA(15m,3s)<-1 means there was a decline, that is, the average EMA price 3 seconds ago is 1% lower than the average EMA price 15 minutes ago;
EMA(5s,1s)>0.1 means there was growth, that is, the current EMA 1s price is 0.1% higher than the average EMA price 5 seconds ago;
Together, these conditions mean that detection will occur after a decline followed by growth; -
The formula MAX(1h,1s)>0.1 means a price breakout above the high, that is, the current average EMA 1s price has become more than +0.1% above the hourly maximum MAX 1h;
-
The formula MAX(1h,1s)<-5 means that the current average EMA 1s price has fallen 5% below its hourly maximum MAX 1h;
-
The formula MAX(1h,1s)<-5 AND MIN(1h,1s)<0.1 AND MIN(1h,1s)>-0.1 means that the current average EMA 1s price has fallen 5% below the hourly maximum MAX 1h, while at the same time the current average EMA 1s price is near the hourly minimum within the range of MIN 1h from -0.1% to +0.1%.
For easier testing of these formulas, the EMA strategy has been added. It has no special parameters of its own, as it is based exclusively on detection according to the CustomEMA filter condition. That is, detection occurs at the moment when the filter conditions are met, so use it with caution!
Unlimited purchases are possible, therefore on the Filters tab of the strategy settings set a delay in the NextDetectPenalty parameter.
Notes:
-
It is important to use Latency filters in the strategy, since EMA price values depend on trade prices; if prices are received with delay, the EMA calculation will be inaccurate;
-
EMA lines are saved in the report at the moment of strategy detection, and for the MoonShot strategy — at the moment the Buy order is triggered, if the EMA filter was enabled in the strategy.